
The Math That is Working Against You and Your Idea
We love inventing bigger and bolder ideas. But having helped organizations do it for decades, we know that leaders with great ideas and passion still face an uphill battle to implementation. Here are the three ways teams evaluate early stage ideas that lower your projects's chances and how you can pivot so the math works in your favor.
The Expected Value Will Never Happen.
And the Median Says Don't Do Anything.
I am a big fan of using monte-carlo simulations to model uncertainty in project values. We even have a math game plan tool on Jump Start Your Brain to enable people to run simulations on any calculation they need. When a new idea is evaluated, teams often calculate an expected project value: probability of success multiplied by potential return. Or they run the simulation and report the median value (50% odds of at least this value). That number gets compared to other opportunities and used to justify the investment.
Here is the problem with using one number as a project value and for decision making. As an example, I ran 10,000 Monte Carlo simulations on a representative early-stage project and plotted every outcome. The expected value was $3.7 million. The number of simulations that landed near $3.7 million was effectively zero.
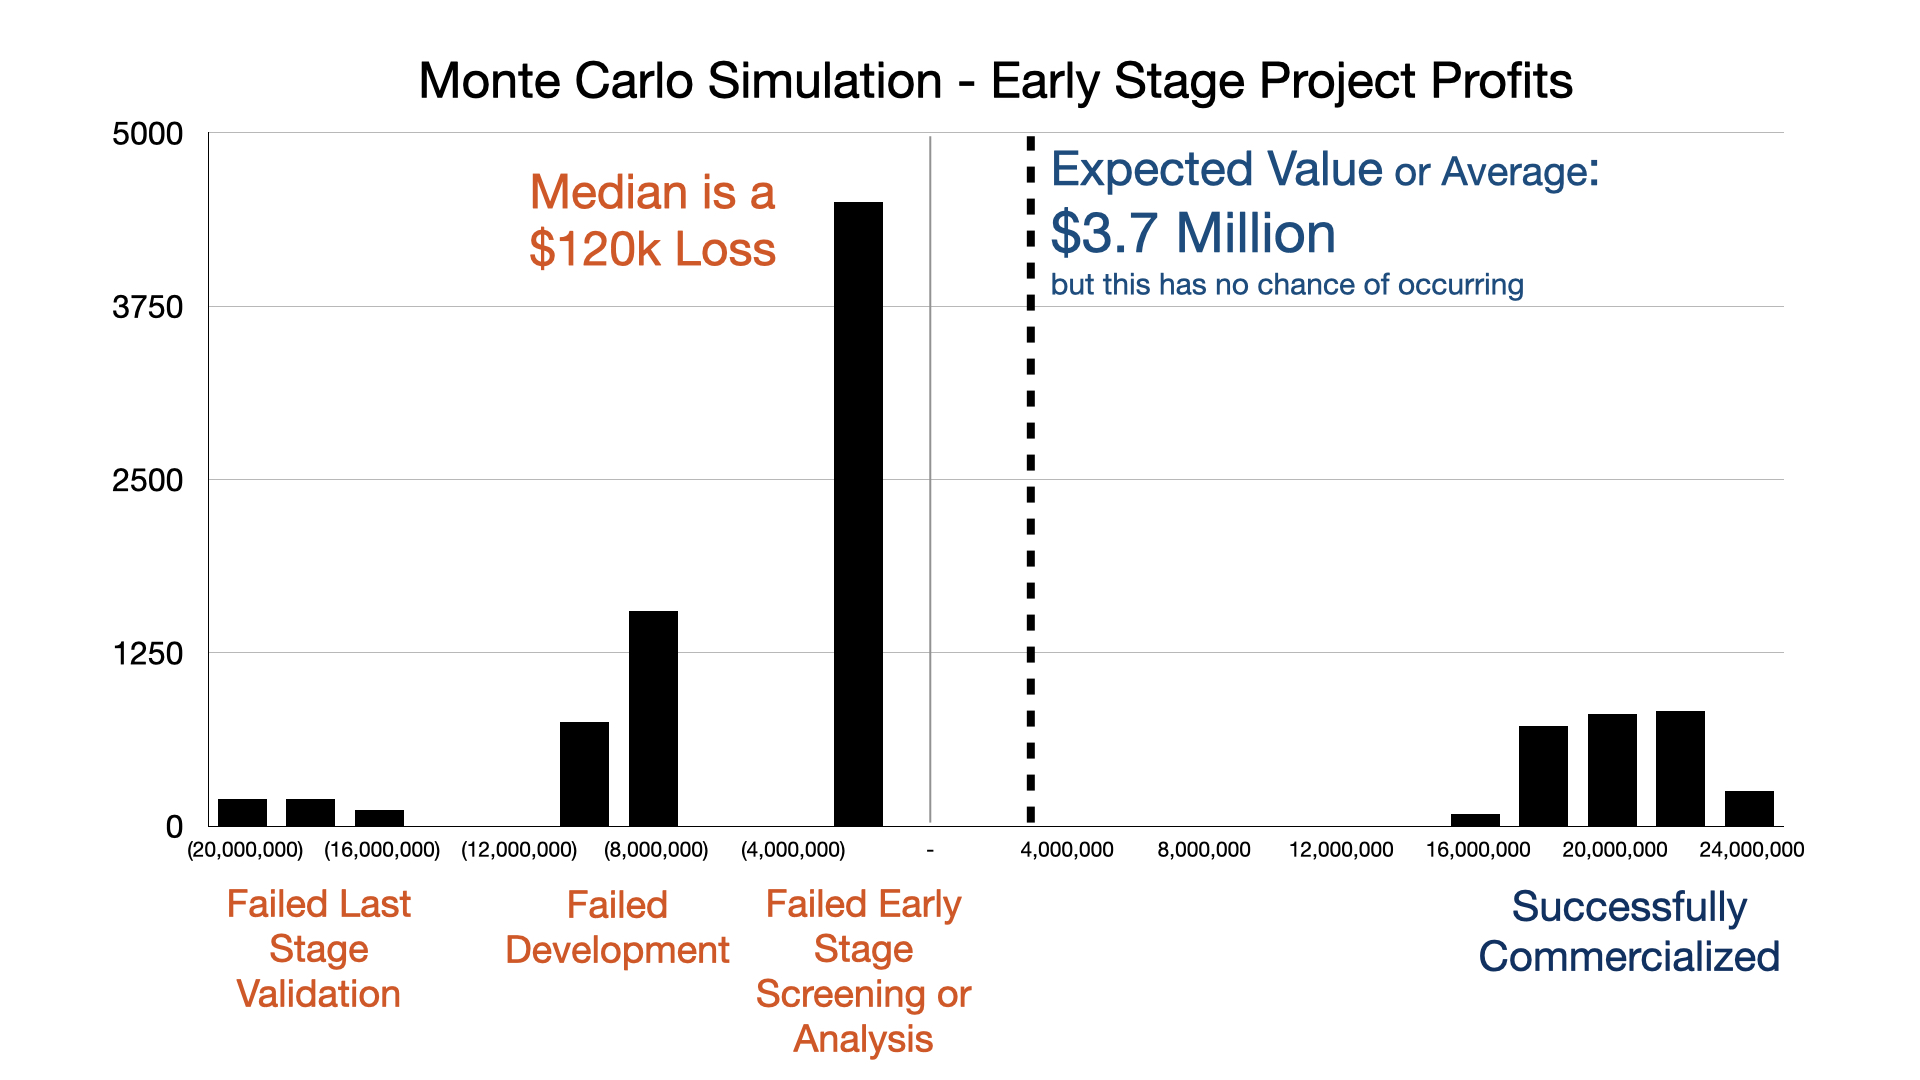
Reality is a project either survives a stage gate or it doesn't. If it fails, you lose the investment made to that point. If it makes it all the way through, the return is significant and well above the expected value.
The system has more impact on the decision making process than the idea's potential. In other words organizations will approve project more likely to survive the system than biggest opportunity. This give you 2 choices, either invent ideas that fit the current system or change the system.
Industry benchmarks. Ranges reflect variance across company sizes and sectors. The simulation in Point 1 assumes rates toward the top of these ranges, your situation could likely have even less profitable outcomes.
This is why acquirers are willing to pay roughly three times more for a technology that has already cleared development than for a technology still in discovery. (Fair Market Royalty Research - Eureka! Ranch 2008) The stage-gate survival is worth that premium.
Stop betting on one version of the idea. Invent ten ways it could work. Different technologies, different form factors, different go-to-market paths. Some of those variants will survive gates that the original would not. This is why we often run "Re-create Sessions" were we take an idea typically right before big investment is about to be made in production or marketing and invent other possibles as backups.
Also actively look for developed technology outside your company that enables the vision. Acquiring or licensing tech that has already cleared development collapses your risk profile immediately and can cut years off the timeline.
Innovative Projects Take Twice as Long.
NPV Punishes Them for It.
Net present value is the right tool for comparing projects with different timelines. The problem is what it does to ambitious ideas. Time sits in the exponent of the discount denominator. That means every additional year does not just add penalty, it compounds it. Radical innovations, which take roughly twice as long as incremental ones, are punished far more than twice as much by the same formula used to evaluate them.
Here is where that time goes, stage by stage:
The same opportunity with a delayed cash flow start, at a conservative 10% discount rate, is worth 17% less before a single additional dollar of risk or development cost is factored in. The calendar made it worth less, so if your idea is going to take longer, if it needs to have an even bigger return.
Now extend that logic to a true moonshot with a ten-year horizon. At 10%, a dollar of return a decade out is worth only 39 cents today. The idea would need to generate more than two and a half times the revenue of a near-term project just to show the same NPV. It is no surprise when companies say they want future and then invest in short term returns. In addition to time, if your idea feels risky, some managers will also increase the discount rate which further devalues the net present value.
When you line up a portfolio and run NPV on each opportunity, the incremental ideas cluster at the top. Faster, cheaper, lower risk, returns arriving sooner. The radical ideas sit at the bottom, penalized by their timeline. The logical portfolio decision, if you follow the model, is to keep funding quick wins.
Many organizations do exactly this, then wonder why the pipeline feels safe but undifferentiated.
If your idea is a genuine moonshot, the NPV model will not be kind to it as a single project. Break it into smaller projects that ladder up. Each sub-project carries a shorter timeline, a defensible return, and a clear connection to the larger vision. A couple years ago when we were at the PDMA conference the award winning company did exactly this with their investments in new product innovation. Great strategy but requires company alignment.
Alternatively, you can make the cash flows big enough and durable enough that the discount rate does not decide the outcome: real competitive differentiation that customers will pay 50% more for rather than 10% more, paired with proprietary protection that keeps competitors from catching up before you recoup the investment.
The other option is to change the system so your ideas can go just as fast as more incremental ideas. We do this with coaching faster learning cycles and have been able to increase speeds 6x.
Fear Is in the Forecast.
And You May Not Know It.
Every project evaluation involves some human judgment. The probability estimates, the market size assumptions, the timeline projections: all of these are made by people who are also managing the daily reality of your organization. And that reality shapes what they believe is possible (and likely).
A team spending three and a half hours a day working around broken systems, fixing others' mistakes, and sitting through flawed meetings does not arrive at a new project evaluation feeling optimistic. They are rational. They know how long things actually take, how often initiatives get stalled, how many promising ideas have died in review. Their estimates reflect that experience, even when they are trying to be objective.
The problem is that this fear is invisible in the model. It shows up as conservative probability estimates, extended timelines, and inflated cost projections. The expected value drops. The idea looks like a bad bet. And nobody in the room names what actually happened: the system friction bled into the forecast.
As a project leader, ask for transparency in decision making, so you learn why your projects are not being approved. Look for patterns and think about if it is a problem with your idea or a problem with the system.
Benchmark where your team actually is. How much time is being lost to flawed work systems? How does your innovation readiness compare to peers in your industry? The answers tell you whether you have culture problems to overcome before you can implement your idea. We resolve these issues with a Eureka! Flywheel approach. Start with small wins and stopping stupid problems caused by the system. After building momentum then we go for your idea. More broken systems will reveal themselves and we will keep improving the road as we drive on it.
If you want to know where your organization stands, the assessment below takes about seven minutes and benchmarks your waste and innovation readiness against leaders across industries. It will also help Greg with his ongoing research, so win for you and the Innovation Engineering community! And if you want to trade ideas on better systems or how to evaluate early-stage opportunities, Greg is happy to meet.
Know Your System Before You Bet On It.
If you are not sure where you stand, the assessment quantifies exactly how much time your organization loses to flawed systems each day and benchmarks your innovation culture against other organizations. Answer 40 questions and get instant results.
Take the Assessment →Questions about the research or want to discuss what the numbers mean for your organization? Reach Greg using the form below.