
New data was released just a few weeks ago from the 2023 Annual Business Survey (Data Year 2022). The survey tracks innovation activity across U.S. industries and provides great insights as to what companies are actually doing when it comes to innovation.
The numbers caught my attention because they connect directly to research Greg Lemmon conducted years ago while studying Innovation ROI and best practices across industries. In that research, Greg analyzed the same national innovation data source and compared it with financial performance to understand which types of innovation actually create value.
At the time, the finding was surprising. Over a 3 year time period, most companies were not innovating.
Only about 30% of companies had introduced any form of innovation in the previous three years. Even more striking, only a handful of industries exceeded the halfway mark. Pharmaceutical manufacturing, communications equipment, and software were among the few where more than 50% of firms reported either process or product innovations.
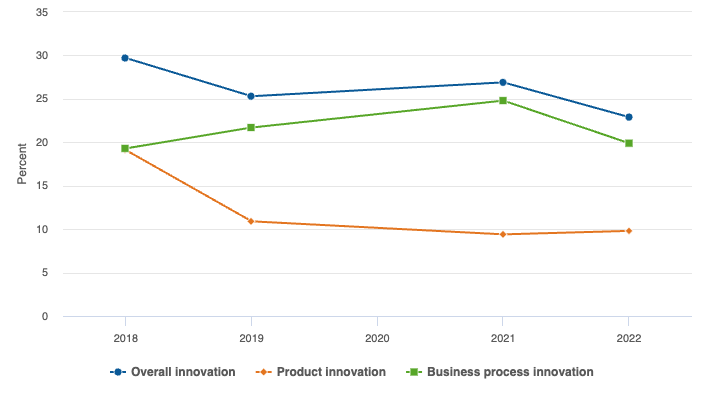
Looking deeper into the data, the breakdown was also telling. About 19% of companies reported introducing at least one new product innovation. Another 19% reported introducing at least one business process innovation. Many organizations were doing one or the other with some doing both.
Fast forward to the newly published data.
The overall innovation rate has dropped.
Now only about 23% of companies report introducing any type of innovation. When the categories are separated, the shift becomes even clearer. Product innovation has fallen to around 10% of firms, while business process innovation remains much closer to its historical level at about 20%.
In other words, organizations are still working on improving how they operate. They are finding ways to streamline workflows, reduce waste, and make internal systems better.
But far fewer are introducing new products.
This matters because of what Greg’s earlier research found when innovation types were compared with financial performance. Process improvement innovation absolutely has value. It often generates strong ROI by reducing cost, improving efficiency, and strengthening operations.
But process innovation alone does not drive growth.
The companies that achieved the strongest growth were the ones introducing disruptive new product innovations that shaped or led their markets. These were the innovations that expanded revenue, opened new categories, and created entirely new demand.
The distinction is important. One form of innovation helps organizations run better. The other helps them grow.
This is why we spend so much time helping organizations strengthen their ability to solve problems and improve systems. Approaches like proactive problem solving help teams identify opportunities, run experiments, and systematically improve the way work gets done.
Those skills are incredibly valuable on their own. They build confidence. They create momentum. They help organizations prove that innovation can produce measurable results.
But something else happens along the way.
The exact same skills that make teams good at process innovation are the ones required to create successful new products. The ability to identify opportunity areas, generate possibilities, evaluate ideas, test assumptions, and learn quickly is transferable across both challenges.
Process innovation becomes the training ground.
When organizations build the capability to consistently improve how they work, they are also building the capability to create what comes next.
The recent decline in product innovation may continue for a few years. Economic uncertainty, resource constraints, and risk sensitivity often push organizations toward safer improvement projects rather than bold new offerings.
But the organizations that keep building innovation capability today will be the ones ready when the moment for growth arrives.
Because when the next wave of product innovation begins, the companies that know how to systematically explore, test, and learn will be the ones best positioned to lead it.
If you’re interested in the research behind these insights, you can explore Greg Lemmon’s earlier analysis published in the Research-Technology Management Journal Innovation ROI Best Practices, which examined how different forms of innovation connect to financial performance.
The Annual Business Survey (ABS) measured innovation by asking companies if they had any incidence of innovation during a 3-year period. For example, the 2023 ABS (data year 2022) asked about innovation during the period 2020–22. Detail across rows may not add to total because of rounding or unavailable NAICS detail for select records beyond the 4-digit industry classification. Detail across columns have been adjusted to add to total. Industry classification is based on dominant establishment payroll. Statistics are representative of companies located in the United States.
National Center for Science and Engineering Statistics and Census Bureau, 2023 Annual Business Survey: Data Year 2022.
Companies Reporting Innovation: 2019 vs. 2022
Percent of companies reporting any product or business process innovation in the past 3 years, by industry
| Industry | NAICS Code | Any Innovation (%) | Product Innovation (%) | Business Process Innovation (%) | |||
|---|---|---|---|---|---|---|---|
| 2019 | 2022 | 2019 | 2022 | 2019 | 2022 | ||
| Yes | Yes | Yes | Yes | Yes | Yes | ||
| All industries | 11, 21–23, 31–33, 42–81 | 25.3 | 22.9 | 10.9 | 9.8 | 21.7 | 19.9 |
| Manufacturing industries | 31–33 | 34.0 | 27.8 | 16.3 | 14.3 | 29.3 | 23.4 |
| Food | 311 | 34.3 | 31.3 | 13.2 | 16.5 | 29.7 | 26.2 |
| Beverage and tobacco products | 312 | 42.3 | 35.6 | 19.1 | 21.7 | 36.3 | 28.9 |
| Textile, apparel, and leather products | 313–16 | 33.2 | 23.5 | 15.9 | 12.8 | 28.4 | 19.4 |
| Wood products | 321 | 25.4 | 20.1 | 9.3 | 7.1 | 22.5 | 18.3 |
| Paper | 322 | 32.1 | 26.7 | 14.1 | 10.8 | 25.2 | 24.9 |
| Printing and related support activities | 323 | 31.3 | 22.4 | 15.9 | 10.3 | 26.3 | 18.9 |
| Petroleum and coal products | 324 | 8.9 | 31.5 | 3.9 | 17.4 | 8.8 | 28.6 |
| Chemicals | 325 | 41.2 | 39.4 | 20.2 | 23.7 | 34.8 | 32.3 |
| Pesticide, fertilizer, and other agricultural chemicals | 3253 | 35.7 | 36.9 | 13.0 | 18.2 | 32.6 | 30.6 |
| Pharmaceuticals and medicines | 3254 | 45.7 | 42.4 | 24.3 | 24.3 | 38.5 | 36.8 |
| Soap, cleaning compound, and toilet preparation | 3256 | 43.7 | 42.1 | 20.5 | 29.0 | 37.5 | 33.0 |
| Other chemicals | other 325 | 39.2 | 37.3 | 19.5 | 22.0 | 32.5 | 30.5 |
| Plastics and rubber products | 326 | 36.3 | 33.3 | 16.8 | 16.7 | 32.1 | 28.5 |
| Nonmetallic mineral products | 327 | 30.3 | 21.5 | 12.3 | 9.9 | 26.9 | 18.6 |
| Primary metals | 331 | 33.3 | 29.4 | 14.0 | 8.1 | 29.7 | 27.7 |
| Fabricated metal products | 332 | 30.7 | 23.8 | 12.6 | 9.1 | 27.5 | 21.1 |
| Machinery | 333 | 41.1 | 31.8 | 22.8 | 20.6 | 35.5 | 25.4 |
| Computer and electronic products | 334 | 51.1 | 42.3 | 33.1 | 28.4 | 41.7 | 33.8 |
| Communications equipment | 3342 | 56.4 | 41.9 | 42.0 | 28.8 | 45.7 | 31.8 |
| Semiconductor and other electronic components | 3344 | 45.1 | 37.6 | 24.8 | 21.1 | 40.5 | 33.0 |
| Navigational, measuring, electromedical, and control instruments | 3345 | 54.6 | 46.1 | 37.5 | 33.3 | 40.9 | 35.6 |
| Other computer and electronic products | other 334 | 50.6 | 42.4 | 32.5 | 30.6 | 43.7 | 32.2 |
| Electrical equipment, appliances, and components | 335 | 44.5 | 38.6 | 26.9 | 22.4 | 35.5 | 31.8 |
| Transportation equipment | 336 | 34.9 | 33.1 | 19.8 | 21.4 | 29.1 | 25.8 |
| Automobiles, bodies, trailers, and parts | 3361–63 | 32.6 | 35.4 | 18.5 | 22.6 | 27.2 | 27.8 |
| Aerospace products and parts | 3364 | 43.9 | 26.7 | 19.5 | 14.8 | 37.4 | 22.5 |
| Other transportation | other 336 | 35.5 | 30.7 | 23.1 | 22.0 | 29.1 | 22.9 |
| Furniture and related products | 337 | 26.6 | 22.0 | 12.0 | 9.4 | 23.2 | 19.7 |
| Miscellaneous | 339 | 32.9 | 26.3 | 17.5 | 14.4 | 27.5 | 21.2 |
| Medical equipment and supplies | 3391 | 34.6 | 27.1 | 19.2 | 15.6 | 27.3 | 22.0 |
| Other miscellaneous manufacturing | 3399 | 31.9 | 25.9 | 16.3 | 13.8 | 27.6 | 20.8 |
| Nonmanufacturing industries | 11, 21–23, 42–81 | 24.9 | 22.7 | 10.7 | 9.6 | 21.3 | 19.8 |
| Agriculture, forestry, fishing, and hunting | 11 | 17.4 | 11.7 | 5.8 | 3.7 | 14.9 | 10.1 |
| Mining, extraction, and support activities | 21 | 12.3 | 12.0 | 3.4 | 4.1 | 11.7 | 10.5 |
| Utilities | 22 | 20.8 | 21.9 | 7.1 | 9.3 | 18.8 | 18.4 |
| Construction | 23 | 18.0 | 15.8 | 6.4 | 5.4 | 15.4 | 14.0 |
| Wholesale trade | 42 | 34.4 | 23.7 | 16.1 | 11.9 | 28.7 | 19.5 |
| Retail trade | 44–45 | 27.0 | 25.3 | 11.7 | 11.8 | 22.7 | 21.2 |
| Transportation and warehousing | 48–49 | 26.6 | 24.5 | 7.5 | 4.7 | 24.7 | 23.6 |
| Information | 51 | 38.5 | 31.7 | 24.8 | 20.4 | 31.8 | 26.2 |
| Publishing | 511 | 46.6 | 40.8 | 31.0 | 28.6 | 39.1 | 33.7 |
| Newspaper, periodical, book, and directory publishers | 5111 | 35.8 | 26.6 | 19.9 | 13.7 | 30.3 | 22.4 |
| Software publishers | 5112 | 58.8 | 53.6 | 43.6 | 42.0 | 49.1 | 44.0 |
| Telecommunications | 517 | 33.9 | 26.6 | 22.0 | 15.5 | 27.2 | 21.6 |
| Data processing, hosting, and related services | 518 | 49.1 | 41.2 | 31.2 | 28.8 | 42.9 | 35.0 |
| Other information | other 51 | 31.6 | 24.5 | 19.8 | 14.2 | 25.1 | 20.1 |
| Finance and insurance | 52 | 26.1 | 22.0 | 10.5 | 6.9 | 22.2 | 20.1 |
| Real estate and rental and leasing | 53 | 20.1 | 16.4 | 7.0 | 4.6 | 17.9 | 15.2 |
| Lessors of nonfinancial intangible assets | 533 | 27.4 | 28.6 | 15.3 | 10.3 | 25.3 | 24.9 |
| Other real estate and rental and leasing | other 53 | 20.1 | 16.4 | 7.0 | 4.6 | 17.9 | 15.1 |
| Professional, scientific, and technical services | 54 | 29.0 | 26.2 | 13.3 | 11.8 | 25.6 | 23.4 |
| Legal services | 5411 | 17.3 | 16.4 | 4.6 | 4.0 | 15.6 | 15.4 |
| Accounting, tax preparation, bookkeeping, and payroll services | 5412 | 20.7 | 22.3 | 6.4 | 6.5 | 18.9 | 20.7 |
| Architectural, engineering, and related services | 5413 | 29.9 | 23.0 | 13.2 | 11.8 | 26.6 | 20.0 |
| Specialized design services | 5414 | 32.0 | 29.2 | 15.3 | 13.3 | 27.9 | 25.7 |
| Computer systems design and related services | 5415 | 43.8 | 36.6 | 24.7 | 22.1 | 39.4 | 32.0 |
| Management, scientific, and technical consulting services | 5416 | 34.0 | 30.9 | 16.5 | 14.8 | 30.2 | 27.9 |
| Scientific research and development services | 5417 | 42.8 | 39.6 | 24.9 | 23.2 | 36.8 | 34.2 |
| Advertising, public relations, and related services | 5418 | 31.8 | 30.1 | 15.5 | 13.4 | 28.1 | 27.1 |
| Other professional, scientific, and technical services | 5419 | 31.1 | 28.6 | 17.7 | 13.9 | 24.2 | 23.8 |
| Management of companies and enterprises | 55 | 21.0 | 16.7 | 7.1 | 8.1 | 17.6 | 13.8 |
| Administrative and support and waste management and remediation services | 56 | 22.4 | 20.7 | 9.3 | 8.2 | 18.9 | 18.2 |
| Educational services | 61 | 33.1 | 36.0 | 18.3 | 21.0 | 26.9 | 29.4 |
| Health care and social assistance | 62 | 24.6 | 24.8 | 11.4 | 11.0 | 20.7 | 21.3 |
| Health care services | 621–23 | 24.5 | 24.3 | 11.1 | 11.0 | 20.6 | 20.8 |
| Social assistance | 624 | 25.9 | 27.9 | 13.2 | 11.0 | 21.1 | 24.7 |
| Arts, entertainment, and recreation | 71 | 22.9 | 22.1 | 11.1 | 11.6 | 18.3 | 17.6 |
| Accommodation and food services | 72 | 24.3 | 25.7 | 8.9 | 10.6 | 21.4 | 22.7 |
| Other services | 81 | 22.4 | 19.7 | 11.0 | 9.1 | 18.0 | 16.6 |