
Who You Test With Changes the Answer
I analyzed 327 ideas and 28,468 consumer responses. The more unique the idea, the more it matters.
I was recently at an AI meetup where people were showing demos of what ideas they are working on to get feedback and network. I noticed the reactions from my group varied more depending on the person's level of comfort with AI than the actual problem the presentor was trying to solve with their idea. This got me thinking about how much of my failures are due to the idea versus not reaching the right audience of early adopters. Turns out more than I thought, especially with unique ideas that have a price.
With breakthrough products and services, it can take as much as six years before sales take off and you truely know whether you have a winner. This is because major innovations take time to diffuse.
Rogers' curve, measured.
In Diffusion of Innovations, Everett Rogers describes people as normally distributed along a curve. Innovators and early adopters buy first. They are followed by the early majority, then the late majority, and finally the laggards.
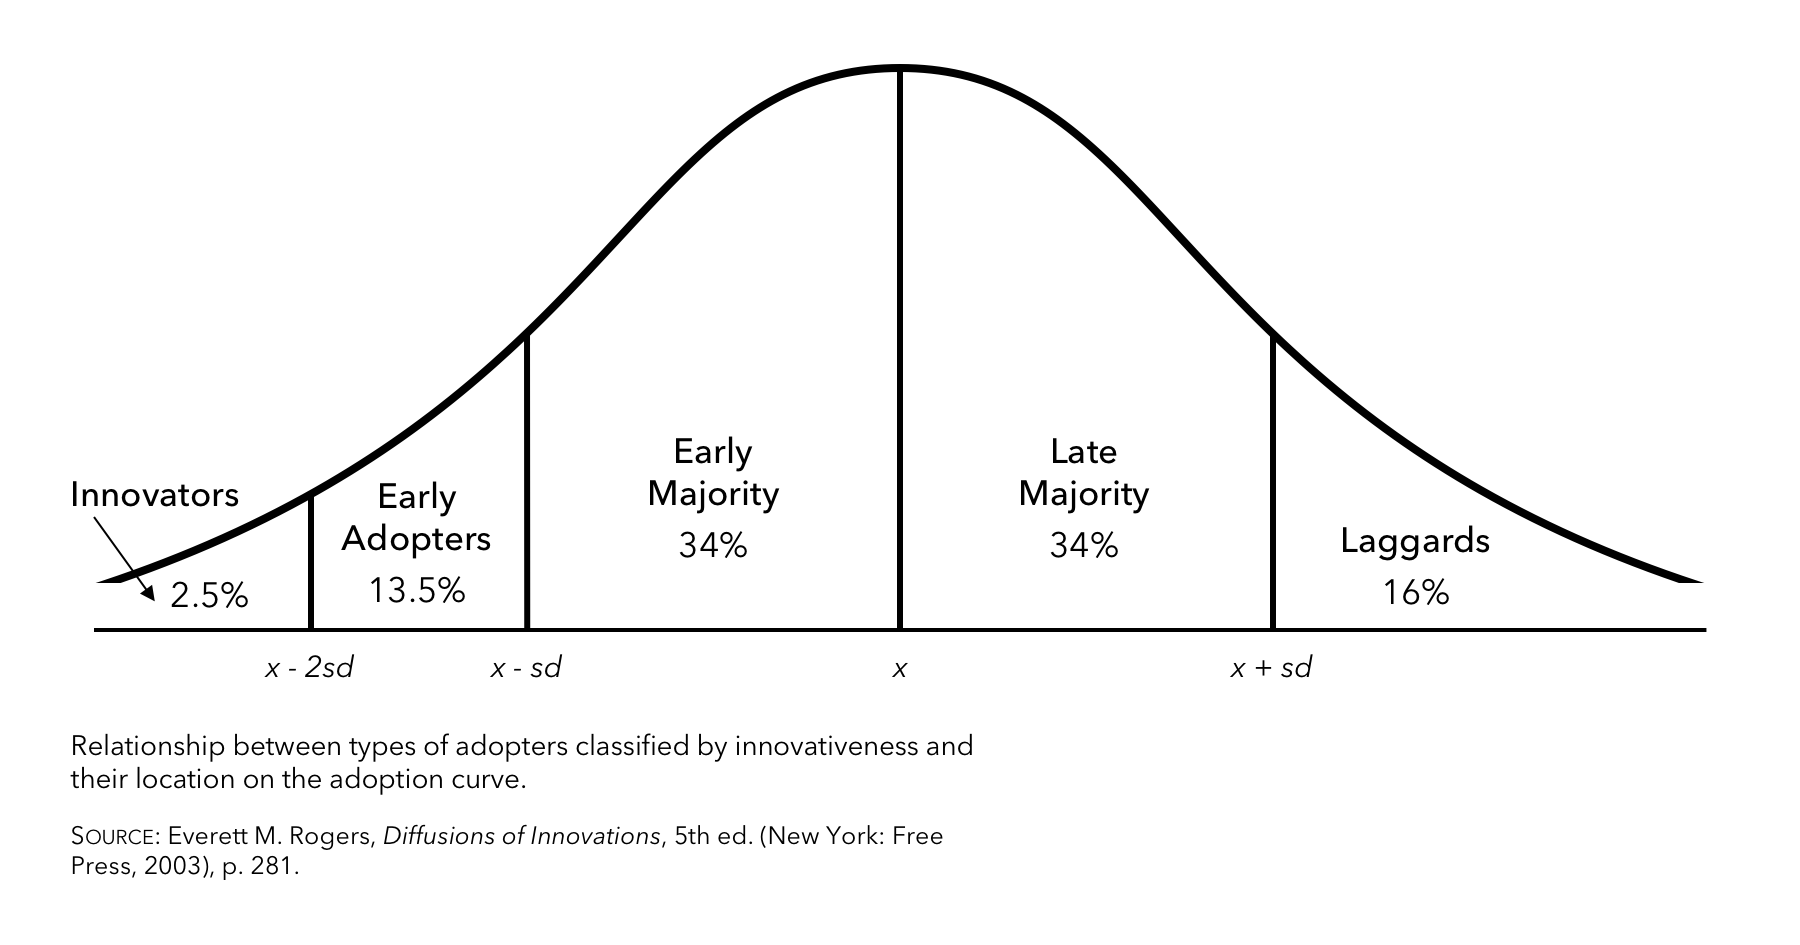
Rogers' diffusion curve: the groups that adopt a new product over time.
Roughly 16% of people are early adopters (including innovators), 34% are the early majority, 34% are the late majority, and 16% are laggards. To find out where a respondent falls, we ask two questions in our concept tests, from 0 (disagree) to 10 (agree). Score yourself.
"I go out of my way to learn about and make use of devices, methods and products that represent advanced technology."
"I am always one of the first, among my friends, to try out new products."
Add your two numbers. That is your early adopter score, from 0 to 20. A 19 or 20 makes you an early adopter. A 0 to 7 makes you a laggard.
ideas analyzed.
consumer responses behind them.
The more they love new things, the more they want your idea.
Across all 327 ideas, purchase intent rises almost step by step with early adopter score. People who scored 0 averaged about 4.5. People who scored a perfect 20 averaged 7.9.
Average purchase intent by early adopter score, all ideas
Purchase intent scale: 0 to 10. Bars start at zero.
Early adopter score (0 to 20)
The gap grows with uniqueness.
Now split the ideas by their average New & Different score and we see stronger correlations for more unique concepts. Also worth noting that we are innovation consultants, so we tend to test more unique ideas than a typical market research firm.
Average purchase intent by adopter group and idea uniqueness
Purchase intent scale: 0 to 10. Bars start at zero.
For ideas with little uniqueness, early adopters scored 1.67 points higher than laggards. For high-uniqueness ideas, the gap was 3.37 points, about twice as large.
A laggard rates your most unique idea (5.40) about the same as an early adopter rates your least unique one (5.30).
The takeaway: who you test with matters, especially if you are testing unique ideas. Test a breakthrough only with people who love new things and you may overestimate how well it will do with everyone else.
Unique groups were defined as 0-5, 5-7.5, and 7.5 to 10. Ideas were tested from 2015 to 2025 using the Rapid Research tool in Jump Start Your Brain.
Ask the early adopter question in every study.
It takes two questions. Expect a roughly normal distribution centered around 15. If your sample is far from that, your scores will be too and your sampling methods may have bias.
How to win with more people.
A better strategy than targeting early adopters is to win with the majority. Statistically there are fewer early adopters out there and while they might adopt your idea quickly, they will also move on to your competition quickly. Instead adapt your offering to score just as well with the majority. To do so remove the roadblocks that Rogers listed.
Not all innovation diffuse slowly, think about ChatGPT as an example. It reached an estimated 100 million users in two months, because it wins on many of Rogers' perceived characteristics of an innovation, and on price.
Where AI is winning
- Low complexity
- Clear relative advantage over searching and writing
- Compatible with daily online habits
- Easy to try
- Easy to see others using it
- Few financial barriers, with a free tier and $20 a month plans
Where AI still struggles
- Organizational and cultural inertia
- Structural, systemic, and skill deficits: risk aversion, education, regulations
Notice that the roadblocks can also be the people and the systems around the offering.
Think about your last innovation project.
How did it test?
Did it win with the majority, or only with the early adopters?
What were the roadblocks?
Sources
- Eureka! Ranch concept testing data: 327 ideas and 28,468 consumer responses. Contact Greg Lemmon with any research questions.
- Everett M. Rogers, Diffusion of Innovations, for the adopter groups and the perceived characteristics of innovations.
- TechSpot, "ChatGPT adds 100 million users in two months, making it the fastest-growing app ever," February 2023, citing a UBS analysis